
Do you have a research paper you have written that is in alignment with our brand?
Send it to us and we’ll consider if it’s appropriate for this part of our website. Think of it like Blinkist for research or academic papers on Trauma Informed Care :)
Send any academic papers you have published to integratenetwork@gmail.com
Adaptive Choice- Making and Socioeconomics
A Means to An End: Adding Value to the Preference Debate
Laura Miller-Ethicist
Helping disadvantaged people involves trusting them to make the best possible choices. Under scrutiny, however, it seems that the disadvantaged often fail to make the best choices for themselves. In this paper, I oppose both the traditional philosophical view that some choices of the disadvantaged are deformed or adaptive and the view of preference utilitarians, who favor aiming to satisfy all preferences.
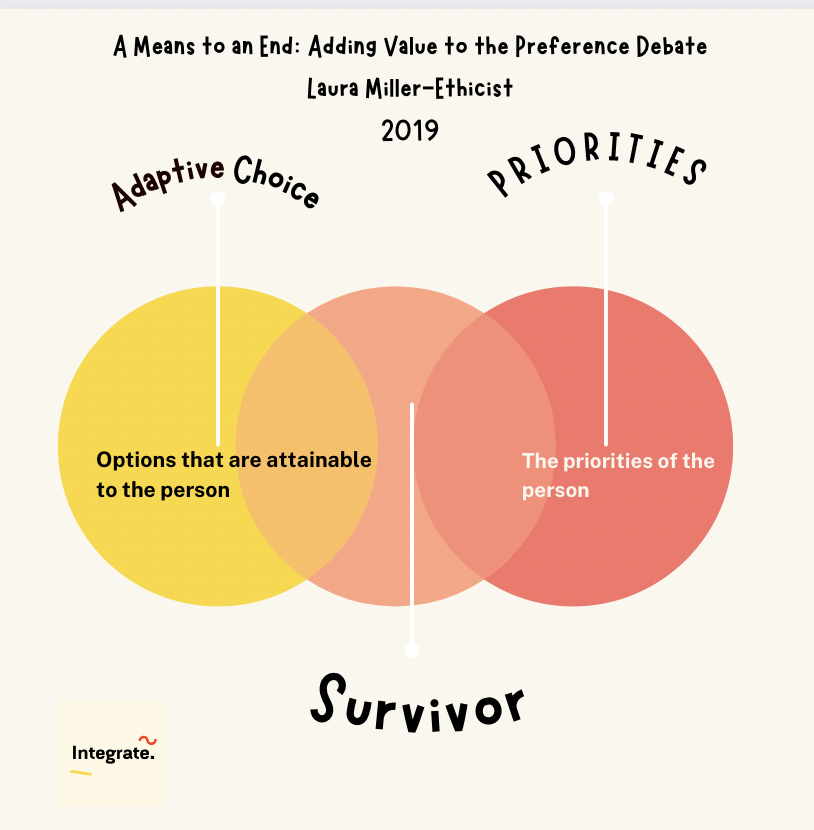
Image ID: three intsersecting circles forming a venndiagram colored yellow, peach and red. The outer circle is labeled as “Adaptive Choice and the far right experience is “The Priorities of the person.” The middle cirlce has “Survivor.”
Helping disadvantaged people involves trusting them to make the best possible choices. Under scrutiny, however, it seems that the disadvantaged often fail to make the best choices for themselves. In this paper, I oppose both the traditional philosophical view that some choices of the disadvantaged are deformed or adaptive and the view of preference utilitarians, who favor aiming to satisfy all preferences.
My rejection of the traditional views of preference is founded on my identification of two distinct kinds of preferences and their relationship to each other: means preferences and end preferences. Means preferences are those choices that are made in order to satisfy a deeply held value while end preferences are those deeply held values. I also claim that persons reprioritize their values as their circumstances change through appropriately adaptive reevaluations. This allows for the rational adaption to circumstances by the disadvantaged. My view licenses intervention to satisfy some but not all preferences. End preferences are protected due to their value and connection to challenging circumstances, while it can be appropriate to try to persuade someone to alter their means preferences.
The title of this work makes clear its aim: to rightly situate a new theory of preference, one that adds value, among the other philosophical theories that have previously been established. This view offers more than a different perspective of preferences. It also assists interventionists on the grounds that aid should be targeted to what matters most to the disadvantaged; their end preferences.
Recommended Citation
Miller, Laura, "A Means to an End: Adding Value to the Preference Debate" (2019). Theses. 363.
https://irl.umsl.edu/thesis/363
Generational Food Scarcity

ALT TEXT: Four circles comparing the generational food divide in our food system as presented by the Purdue University College of Agriculture January -June 2022. 30% of adults in Generation Z experienced food insecurity, 19% of millennials, 21% of Gen X, and 7% of baby boomers.
Food Security by Generation: A Survey completed by Purdue Unversity School of Agriculture (January - June 2022
Submitted by Trauma-Informed Integrate SMEJenna Little at www.jennalittle.com
Breaking the inter-generational cycle of malnutrition with focus on adolescent girls | The Financial Express. (n.d.). Www.financialexpress.com. Retrieved January 17, 2023, from https://www.financialexpress.com/lifestyle/health/breaking-the-inter-generational-cycle-of-malnutrition-with-focus-on-adolescent-girls/2102433/lite/
“Since January, around 30% of Gen Z adults have experienced or are experiencing food insecurity, compared to around 19% of Millennial and Gen X adults and 7% of Boomers,” said Jayson Lusk, the head and distinguished professor of agricultural economics at Purdue, who leads the center. “Those who are younger tend to have lower incomes, so the results aren’t necessarily surprising, but we need to pay attention to it. Food inflation is outpacing salary growth, and it hits those with the lowest incomes the hardest.”
Purdue experts conducted and evaluated the survey, which included 1,200 consumers across the U.S.
Additional key results include:
16% of all households are food insecure.
Most consumers are worried about the impacts of the war in Ukraine on food supplies.
Food demand and happiness continue to be price insensitive.
Trust in the FDA dropped more than 20% from last month.
A Sustainable Food Purchasing (SFP) Index of 70/100.
Read full survey at this link
The generational divide shows in our food system, too [Review of The generational divide shows in our food system, too]. Purdue University. https://www.purdue.edu/newsroom/releases/2022/Q3/the-generational-divide-shows-in-our-food-system,-too.html
Image ID: ALT TEXT: Four circles comparing the generational food divide in our food system as presented by the Purdue University College of Agriculture January -June 2022. 30% of adults in Generation Z experienced food insecurity, 19% of millennials, 21% of Gen X, and 7% of baby boomers.
Risk and Protective Factors for Adervers Childhood Experiences (ACES)
Risk and Protective Measure for Adverse Childhood Experiences for ACES
See the Study from The Center for Disease Control
Reference
Risk and Protective Factors |Violence Prevention|Injury Center|CDC. (n.d.). https://www.cdc.gov/violenceprevention/aces/riskprotectivefactors.html

Image ID:
Two-column comparison chart that shares information on risk and protective measures for Individuals and Families. The left-hand column says “Risk Factors” and the Right column says (Protective)
Text under the left-hand column that says Risk Factors:
-Families with low income
-Children and youth who don’t feel close to their parents/caregivers
-Families with high conflict
-Families experiencing high levels of parenting stress
Two-column comparison chart that shares information on risk and protective measures for Community. The left-hand column says “Protective” and the Right column says (Protective)
-Children who have positive friendship
-Families with strong social support networks and positive relationships environment
-Families where caregivers/adults work through conflicts
-